
Introduction to Machine Learning Classification Algorithms
In today's data-driven world, the ability to extract valuable insights and make informed decisions from large amounts of data is of paramount importance. Machine learning, a powerful subset of artificial intelligence, offers techniques and algorithms that enable computers to learn and make predictions or decisions without being explicitly programmed. One crucial aspect of machine learning is classification, which involves categorizing data into distinct classes or groups based on certain attributes or features.
Classification algorithms lie at the core of many real-world applications, ranging from email spam filtering to disease diagnosis and fraud detection. By understanding patterns and relationships within data, these algorithms can autonomously classify new instances, enabling organizations to streamline processes, enhance efficiency, and gain a competitive edge. Classification in machine learning can require two or more categories of a given data set. Therefore, it generates a probability score to assign the data into a specific category, such as spam or not spam, yes or no, disease or no disease, red or green, male or female, etc.
Before diving into specific algorithms, it is essential to grasp the basics of supervised learning, as it forms the foundation of classification. Supervised learning involves training a model on labeled data, where the input features and their corresponding target outputs are known. This labeled data serves as a training set, allowing the model to learn from example instances. Through a process of iteratively adjusting its internal parameters, the algorithm learns to map the input data to the correct output class.
To effectively understand and apply classification algorithms, this blog will provide insights into commonly used algorithms, including Logistic Regression, Decision Trees, Random Forests and Support Vector Machines (SVM).
Classification Algorithms
Logistic Regression
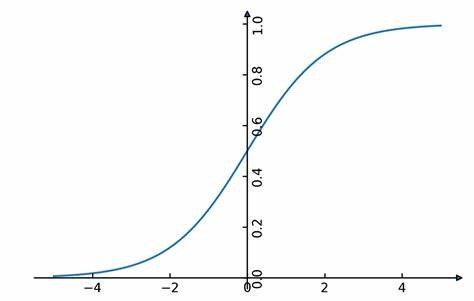
Logistic regression is a widely used classification algorithm that is particularly suitable for binary classification problems. It models the relationship between the input features and the probability of an instance belonging to a particular class. By utilizing a logistic function, the algorithm maps the inputs to a probability value between 0 and 1. Based on a predefined threshold, the model classifies the instance into the corresponding class. Logistic regression is computationally efficient, easily interpretable, and works well with both small and large datasets. However, it assumes a linear relationship between the input variables and the log-odds of the target variable, making it less suitable for complex nonlinear problems.
Decision Trees and Random Forests
Decision trees are versatile classification algorithms that recursively split the data based on the values of the input features. Each internal node represents a feature, and each leaf node represents a class prediction. By following the tree's branches, an instance moves from the root node to a leaf node, resulting in a specific class assignment. Decision trees are intuitive, easily interpretable, and handle both numerical and categorical data. However, they are prone to overfitting and can create complex trees that struggle with generalization.
Random forests, on the other hand, address the limitations of decision trees by combining multiple decision trees into an ensemble model. Each tree is trained on a random subset of the training data, and the final prediction is made by averaging or voting among the individual trees' predictions. By introducing randomness and diversity, random forests achieve better generalization and reduce overfitting. They can handle large and high-dimensional datasets, maintain interpretability to some extent, and provide feature importance measures. However, the trade-off is increased complexity and potentially longer training times.
Support Vector Machines (SVM)
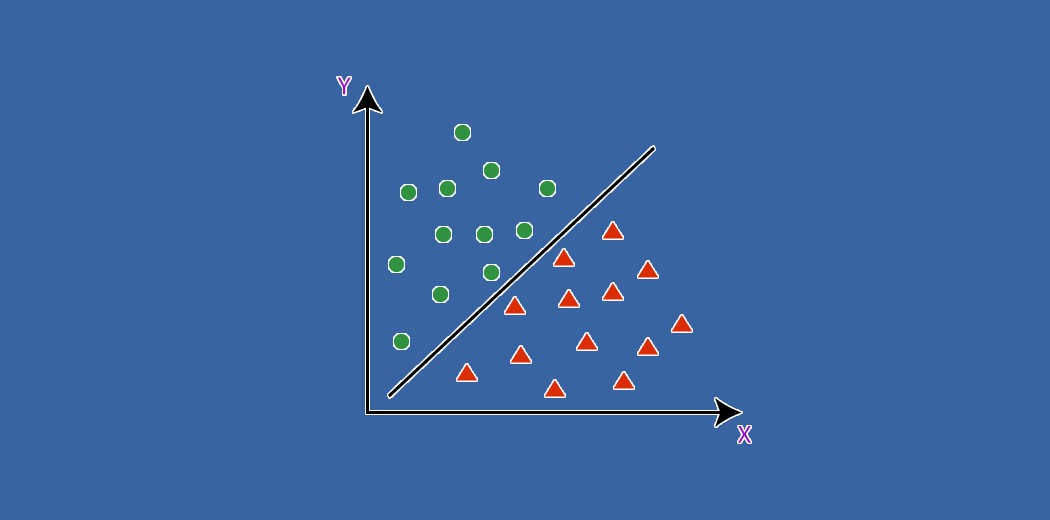
Support Vector Machines (SVM) are powerful classification algorithms that aim to find an optimal hyperplane in the input feature space to separate the different classes. The algorithm creates a decision boundary with the maximum margin between the instances of different classes, aiming to achieve robust generalization. SVMs can handle both linear and nonlinear classification tasks through the use of kernel functions, which transform the input data into higher-dimensional spaces. SVMs are effective in high-dimensional spaces, have good generalization performance, and can handle outliers. However, SVMs can be computationally expensive, require careful tuning of hyperparameters, and have limited interpretability compared to simpler models like logistic regression.
To assist in comparing these classification models, the following table summarizes their key characteristics:
| Algorithm | Interpretability | Handling Nonlinearity | Handling Outliers | Scalability |
|---|---|---|---|---|
| Logistic Regression | High | Requires linear relationship | Susceptible to outliers | High |
| Decision Trees | Medium to High | Capable | Robust | High |
| Random Forests | Medium | Capable | Robust | Medium to High |
| Support Vector Machines | Low | Can handle through kernel trick | Robust | Low to Medium |
It is important to note that interpretability and handling nonlinearity in decision trees and random forests can vary based on the depth of the trees and the complexity of the dataset. SVMs can handle nonlinear problems through kernel functions, but their interpretability is typically lower compared to logistic regression or decision trees. Scalability is subjective to factors such as data size, dimensionality, and available computational resources.
Metrics to Evaluate
When evaluating the performance of classification models, several metrics can be used to assess their accuracy, precision, recall, and overall effectiveness. Below are some commonly used metrics:
Confusion Matrix: A confusion matrix displays the count of true positives, true negatives, false positives, and false negatives. It provides a comprehensive view of the model's performance, enabling analysis of specific errors and the balance between different types of mistakes.
| Prediction is True | Prediction is False | |
|---|---|---|
| Actual is True | True Positive(TP) | False Negative(FN) |
| Actual is False | False Positive(FP) | True Negative(TN) |
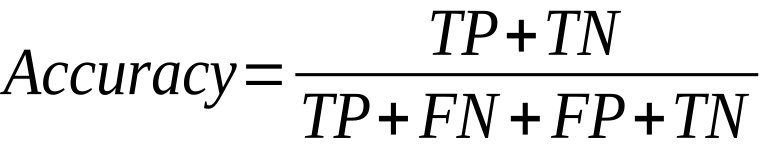
Accuracy: The simplest and most commonly used metric, accuracy measures the proportion of correctly classified instances out of the total number of instances in the dataset. It provides an overall measure of the model's performance but can be misleading if the dataset is imbalanced.
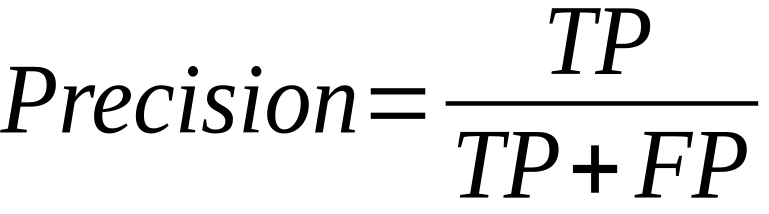
Precision: Precision is the proportion of true positive predictions out of the total positive predictions. It indicates how well the model predicts the positive class and provides insights into the model's ability to avoid false positives.
Recall: Also known as sensitivity or true positive rate, recall measures the proportion of true positives predicted correctly out of the actual positive instances. It shows how well the model identifies the positive class without missing any instances.

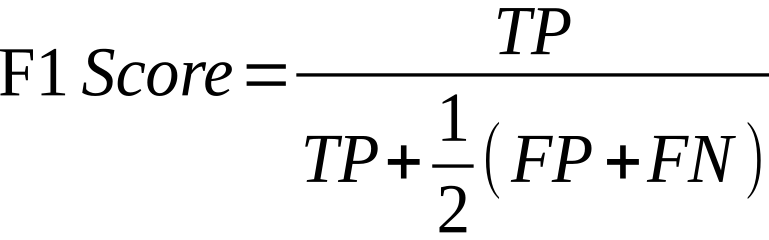
F1 Score: The F1 score is the harmonic mean of precision and recall. It provides a balanced measure of the model's precision and recall, considering both false negatives and false positives. F1 score is particularly useful when dealing with imbalanced datasets.
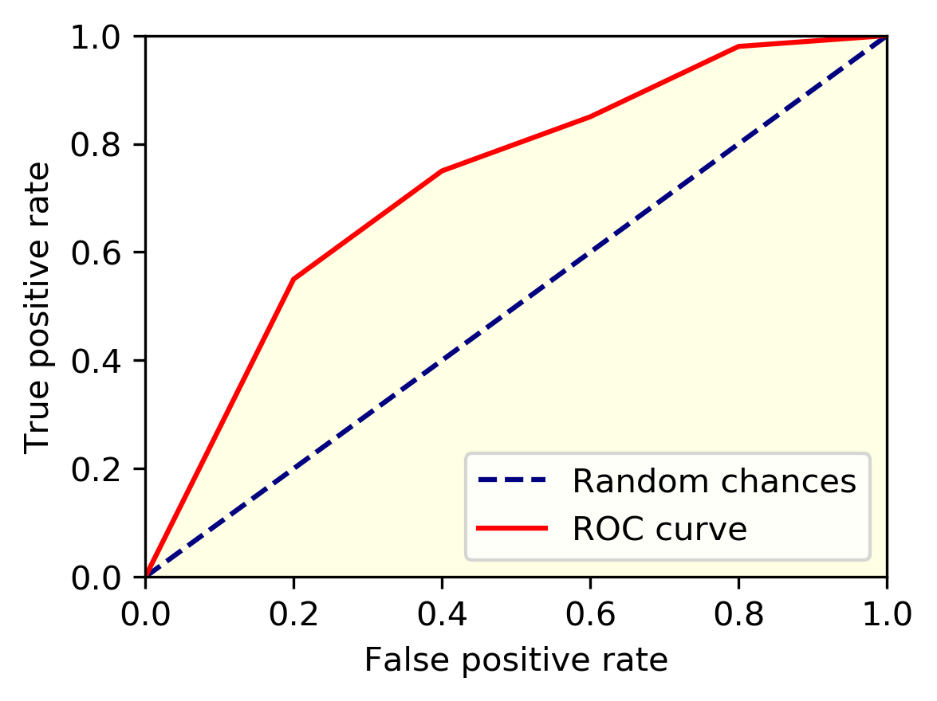
Area Under the ROC Curve (AUC-ROC): The ROC curve plots the true positive rate against the false positive rate at various classification thresholds. AUC-ROC calculates the area under this curve, providing a single value that represents the model's ability to differentiate between positive and negative instances. AUC-ROC ranges between 0 and 1, with a higher value indicating better performance.
Conclusion
In conclusion, machine learning classification algorithms play a crucial role in extracting insights and making informed decisions from large amounts of data. These algorithms, such as logistic regression, decision trees, random forests, and support vector machines, have different strengths and weaknesses that make them suitable for various applications.
Overall, understanding and applying classification algorithms can enable organizations to streamline processes, enhance efficiency, and gain a competitive edge in today's data-driven world. By harnessing the power of machine learning, they can make accurate predictions and informed decisions based on patterns and relationships within data.